Jane Street Puzzle - November 2024
Two random points, one red and one blue, are chosen uniformly and independently from the interior of a square. To ten decimal places, what is the probability that there exists a point on the side of the square closest to the blue point that is equidistant to both the blue point and the red point?
(Or, if you want to send in the exact answer, that’s fine too!)
Solution
Perpendicular Bisectors
We begin by noting that when dealing with points equidistant from two other points, perpendicular bisectors are useful.
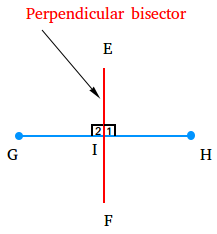
In the above, after connecting points G and H, the perpendicular is the line that intersects this line at a right angle, which in this case is the red line. All points on this red line are equidistant to both points G and H.
Since all points on the perpendicular bisector are equidistant from both the red and blue points, the condition stated in the prompt is satisfied if the perpendicular bisector passes through the side closest to the blue point.
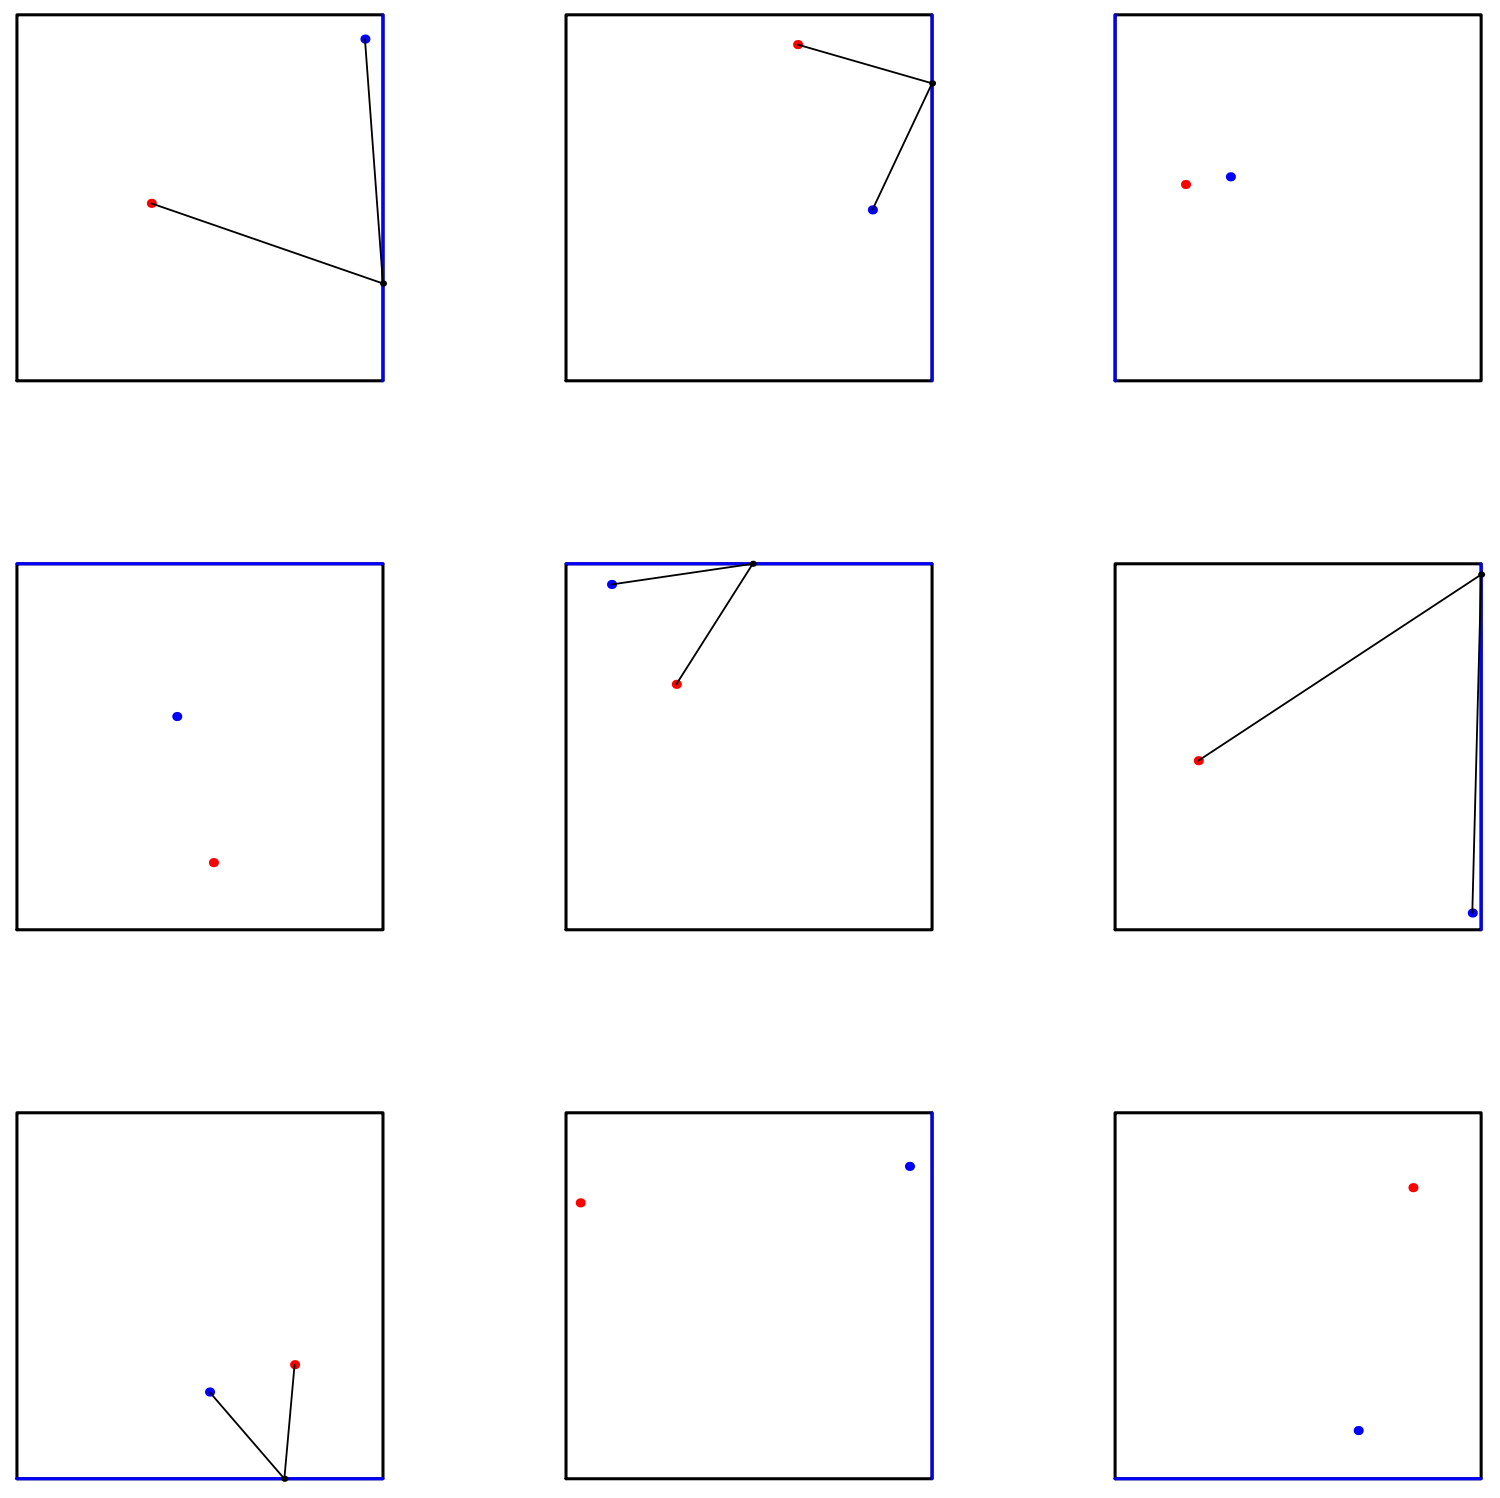
For example, consider the widget below.
If you click generate points, then two points will be randomly generated. The side of the square closest to the blue point will be highlighted in blue, and the perpendicular bisector will be shown in green. If the perpendicular bisector does not pass through the highlighted side, then the condition is not satisfied. If the perpendicular bisector does pass through the highlighted side, then there will be a point on this side that will be equidistant to both red and blue points.
Try running some simulations to see how this works.
No Success
Just clicking through a bunch of simulations gives us a very rough idea of the probability. It looks like the condition is satisfied pretty often.
Monte Carlo Simulations
Running the above 'simulation' many times and dividing the number of successful trials by the total number of trials gives a better estimate of the probability that the condition is satisfied.
Here's the Python code to run one million trials.
import numpy as np

def simulate_probability(num_simulations=1000000):
    # Generate random points B and R inside the unit square
    x_B = np.random.uniform(0, 1, num_simulations)
    y_B = np.random.uniform(0, 1, num_simulations)
    x_R = np.random.uniform(0, 1, num_simulations)
    y_R = np.random.uniform(0, 1, num_simulations)

    B = np.column_stack((x_B, y_B))
    R = np.column_stack((x_R, y_R))

    # Determine the closest side S to point B
    distances_to_sides = np.column_stack((x_B, 1 - x_B, y_B, 1 - y_B))
    min_distance_indices = np.argmin(distances_to_sides, axis=1)
    sides = np.array(['x=0', 'x=1', 'y=0', 'y=1'])[min_distance_indices]

    # Compute the intersection points of the perpendicular bisector
    mid_points = (B + R) / 2
    directions = np.column_stack((-(R[:, 1] - B[:, 1]), R[:, 0] - B[:, 0]))

    # Avoid division by zero
    epsilon = 1e-8
    directions[directions == 0] = epsilon

    # Initialize success count
    success_count = 0

    # Handle sides 'x=0' and 'x=1'
    for side_value, side_name in zip([0, 1], ['x=0', 'x=1']):
        mask_side = sides == side_name
        idx = np.where(mask_side)[0]
        x_P = side_value
        t = (x_P - mid_points[idx, 0]) / directions[idx, 0]
        y_P = mid_points[idx, 1] + t * directions[idx, 1]
        valid = (y_P >= 0) & (y_P <= 1)
        success_count += np.sum(valid)

    # Handle sides 'y=0' and 'y=1'
    for side_value, side_name in zip([0, 1], ['y=0', 'y=1']):
        mask_side = sides == side_name
        idx = np.where(mask_side)[0]
        y_P = side_value
        t = (y_P - mid_points[idx, 1]) / directions[idx, 1]
        x_P = mid_points[idx, 0] + t * directions[idx, 0]
        valid = (x_P >= 0) & (x_P <= 1)
        success_count += np.sum(valid)

    probability = success_count / num_simulations
    return probability

# Run the simulations
num_simulations = 1000000
estimated_probability = simulate_probability(num_simulations)
print(f"Estimated Probability: {estimated_probability}")
Estimated Probability: 0.491976
Let's run the simulations a couple of more times and see the results.
Estimated Probability: 0.491673
Estimated Probability: 0.491214
Estimated Probability: 0.491537
It looks like the probability is close to 0.491.... something.
However, the problem says we need to give the probability to 10 decimal places.
Running enough simulations to determine the probability to 10 decimal places with a high degree of confidence (say, ~ 99%) would be computationally infeasible, and so we must change our approach.
Determining a Pattern
To estimate the probability to 10 decimal places, we need a more precise and analytical approach.
I started by 'fixing' the blue point inside of the triangular portion of the unit square such that the closest side to this point will always be the bottom.
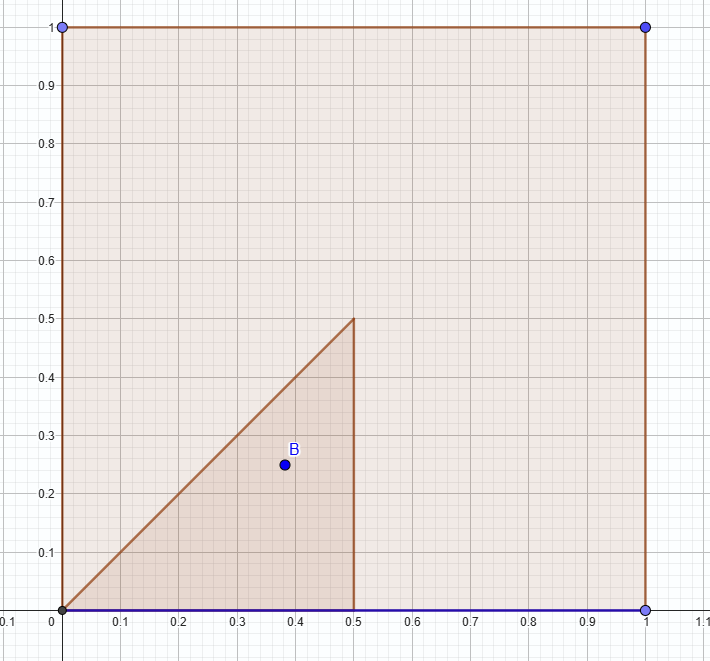
When the blue point is in this region, the closest side will always be the bottom.
Moreover, we can always arrive at such a setup by rotating and 'flipping' the square, since these transformations do not impact the distribution of points in the square.
Next, I experimented with the position of the red point to identify any patterns regarding when the perpendicular bisector intersected the bottom side.
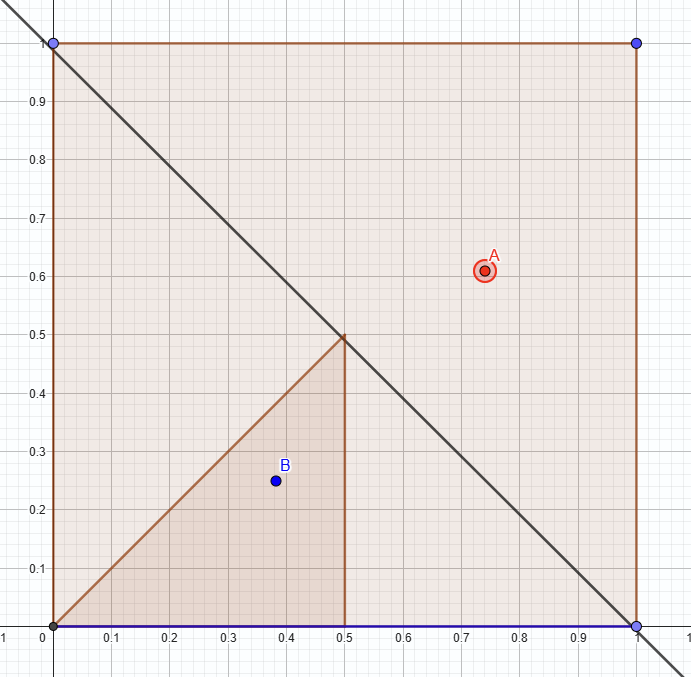
Here, since the perpendicular bisector intersects the bottom side, that point is equidistant to B and A, and so satisfies the condition.
After moving the red point around and seeing how the perpendicular bisector changed, I notice that for the perpendicular bisector to intersect this bottom side, it must be within a particular region.
Namely, it must be inside of exactly one of two circles - one circle centered at (0,0), and one centered at (1,0), with both circles passing through point B, as shown in the image below.
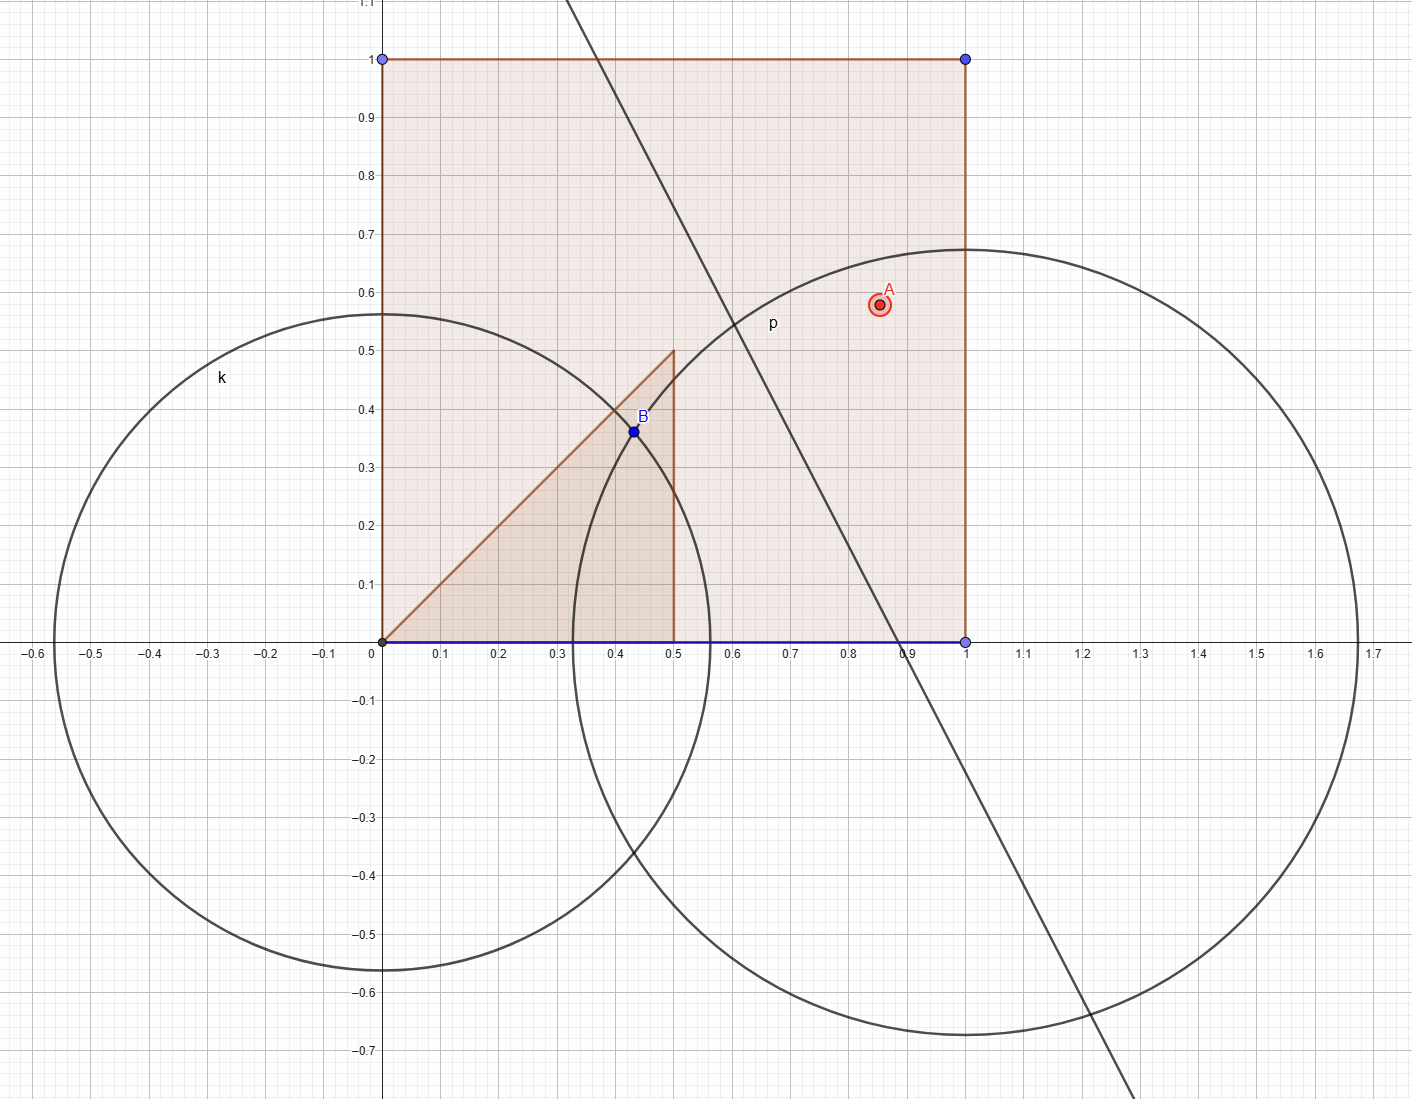
Here, if the red point is inside either of these circles, but not within the overlapping region, then the perpendicular bisector will intersect the bottom side of the unit square.
You can experiment with point positions using this link: Geogebra Simulation
To find the probability that the perpendicular bisector intersects the bottom side of the unit square, we divide the area of this region by the total area available for the point, which is 1 since we are working within a unit square.
The area of this region is equal to a quarter of the area of each circle (since one quarter of each circle lies within the unit square), minus the area of the overlapping section divided by two (since only half of the overlapping section is within the unit square).
Formula for the Probability When 𝐵 is Fixed
Using some formula I found that gives the area of this intersecting region, we can calculate the required probability for a fixed point B using the following function:
import math

def total_area(x, y):
    # Calculate the radii of the two circles
    r1 = math.hypot(x, y)
    r2 = math.hypot(1 - x, y)

    # Compute the areas of the circles within the unit square (quarter of each circle)
    A1 = (math.pi * r1**2) / 4
    A2 = (math.pi * r2**2) / 4

    # Distance between the centers of the circles
    d = 1.0

    # Compute the angles for the intersecting area segments
    cos_angle1 = (d**2 + r1**2 - r2**2) / (2 * d * r1)
    cos_angle2 = (d**2 + r2**2 - r1**2) / (2 * d * r2)

    angle1 = math.acos(cos_angle1)
    angle2 = math.acos(cos_angle2)

    # Compute the area of overlap
    overlap = (
        r1**2 * angle1
        + r2**2 * angle2
        - 0.5
        * math.sqrt(
            max(0.0, (-d + r1 + r2) * (d + r1 - r2) * (d - r1 + r2) * (d + r1 + r2))
        )
    )

    # Total area within the unit square, excluding overlap
    total_area = A1 + A2 - overlap

    return total_area
For instance,
print(total_area(0.5, 0.5)) # Returns 0.4999999999999998
Which means that when the point B is at point (0.5, 0.5), the probability that point R is within the required region, and hence that the perpendicular bisector intersects the bottom edge, is 50%.
Average Probability for Non-Fixed B
Next, we calculate the average probability for non-fixed 𝐵.
In other words, what this average area is for B within this triangular region, given by 0 < x < 0.5 and 0 < y < x.
We can use integration to do this.
To compute the average probability for B uniformly distributed within the triangular region, the integral is given by:
We can compute this using scipy's integrate module
from scipy import integrate

def integrand(x, y):
    # Compute the total area for the given (x, y)
    area = total_area(x, y)
    return area


def region_integration():
    # Integration limits for x: from 0 to 0.5
    def inner_integral(x):
        # Integration limits for y: from 0 to x
        return integrate.quad(lambda y: integrand(x, y), 0, x)[0]

    # Integrate over x from 0 to 0.5
    result, error = integrate.quad(inner_integral, 0, 0.5)
    return result, error
Now all we have to do is call region_integration to get our result, which we should multiply by 8 since we are only considering 1/8 of the square in our initial setup.
# Compute the probability by integrating over the triangle
probability, error = region_integration()

print(f"The estimated probability is: {probability * 8:.13f}")
print(f"The error is: {error}")
Which gives:
The estimated probability: 0.4914075788383
The error: 6.819650106269889e-16
This answer aligns with our earlier Monte Carlo simulations, and the error is negligible for accuracy to 10 decimal places.
Therefore, our answer is: 0.4914075788